How many people do you need in a class so that the odds of at least two of them having the same birthday are 50%?
This is a classic problem in statistics, and takes some care to work out. It’s easier, I think, to restate the problem as how likely is it all of a group’s birtdays are different? Think about it for a second. If you can’t do the math, no shame there, just come up with a guess. How many people can you cram into a room until there is a 50% chance of a shared birthday?
Well, in a “group” of 1 person, there are 365 possible birthdays and all 365 are acceptable, so the odds there are exactly 1. If you add someone, there are only 364 unique birthdays remaining, but they can have any of the 365. So the odds of a unique birthday are 364/365, or 99.7% The same is true of the next person who arrives; There are 363/365 birthdays left. If you multiply that by the 2 person case, you get 99.2%. It turns out you only have to bring in 23 people before the odds of them all being the different drops to less than 50%. Personally, I think that sounds low!* Doing something sort of unlikely repeatedly makes it likely.
The problem facing us a little different. We want to know how likely it is a classroom will have a kid with COVID-19 in it. The exact piece of computation we’re going to use is a little different, but the finding is the same: Doing something unlikely repeatedly makes it likely. Let’s assume that 1 in 3 people has an active Covid-19 case. (This is very high, but is easy to compute for. We’ll look at more likely numbers shortly) What are the odds that no one has Covid-19?
Well, in a “class” of 1 person, there is a 2/3 chance that they do not have it. The next person who walks in also has a 2/3 (67%) chance, and multiplying that together, we get 4/9 (44%). And the next student who arrives brings a 2/3 chances, which gives 8/27 (30%). If you sense this is trending towards zero as more kids show up, you are correct. I have shunted the formula to the end so people who hate math do not have to gaze upon the horror that is algebra**.
US class size is fairly variable, averaging 23, which is a delightful coincidence with the Birthday Paradox. Assuming that is the typical class, we can graph the chances of a class of 23 having a student who is infected against the rate of infection in the community at large:

For low community spread—less than 2%—the chance of having an infected student can be estimated at about 20 times the rate of community spread. If we take Arizona at their word, about 1.4% of Arizonians have Covid-19, which implies the chance of a classroom having a kid with COVID-19 is 28%. Undercounting matters here too. At the extreme end, the director of the CDC thinks we may be undercounting by a factor of 10, implying a 97% chance of an Arizona classroom having a kid with Covid-19.
A few limits to this analysis. First, it is very sensitive to the number of kids in the classroom. This graph is harder to read, but the red line is 23 students; each black line above is one more student; each below is 1 fewer:
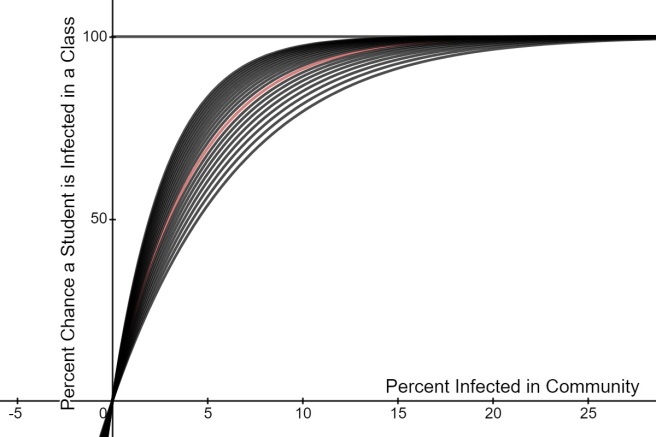
A harder problem is that this assumes students are randomly taken from the population. In reality, we know Covid-19 spreads through networks, so it is likely some schools would have more cases than others for reasons that aren’t random. A particularily clear example and source of this bias is that children from the same household will obviously be much more likely to test positive and be in the same school. I’ve neglected teachers and anyone else in the classroom, but that second graph will address that well enough. We could also get into how in secondary education students have multiple classes a day. and the odds stack. A 10% risk over 6 classes is a 46% chance of exposure. (But in reality its lower since they are likely to have repeat classmates.)
Importantly, this is just a start to analyzing risk. We know chidren are most often asymptomatic carriers and that asymptomatic spread is much less common than symptomatic spread. (Bear in mind, a child who shows no symptoms but will go onto is pre-symptomatic and more likely to pass the virus on.) Being in class with someone who has a quiet case of COVID-19 is not the only dimension to conisider.
Nonetheless, “only” 2300 active cases in Houston implies that 2% of classrooms can expect to have a COVID-19 kid. I don’t know that your average parent in Houston wants their kid in class if there is 1 in 50 chance of being exposed to the virus. And it doesn’t matter since in reality, the odds are closer to 1 in 3.
Whether its sharing a birthday or bringing the pandemic to class, statistics offers us a clear lesson: Doing something sort of unlikely repeatedly makes it likely. You can brand it as safe, but the mathematics underlying it are unmoved.
*For homework, please redo the problem allowing for leap years. #MostlyJoking
**It turns out:

where P is the probability any of the students are infected, p is the probability each individual student is infected, and n is the number of studen